per-node health · aggregate trends · fleet control
Your whole network at a glance
with Nodes
Monitor live host health, track call volume against historical baselines, and manage your entire fleet without jumping between tools.
Need call-level detail?
Unified Visibility Across Health, Capacity, and Trends
Nodes answers the questions a single call never can: is every device up, is anything running hot, is the network busier or quieter than usual, and is the standby ready if a node fails. It does that across three layers that work together.
| Layer | What you see |
|---|---|
| Node health | Live up or down state for every node, with CPU, RAM, memory, and disk telemetry, so a problem is visible before it becomes an outage. |
| Capacity | Concurrent sessions and CPS per node against its limits, and per-node state for active and standby HA pairs, so you see headroom and pressure across the fleet at a glance. |
| Aggregate call trends | Call volume, answer rates, and failure rates rolled up across the network, with peaks and troughs plotted against historical averages and earlier weeks. |
This builds on the monitoring capabilities of ProSBC Monitoring as a Service and the TB Analytics tooling that already ships with TelcoBridges devices, consolidated into the same platform that powers Trace.
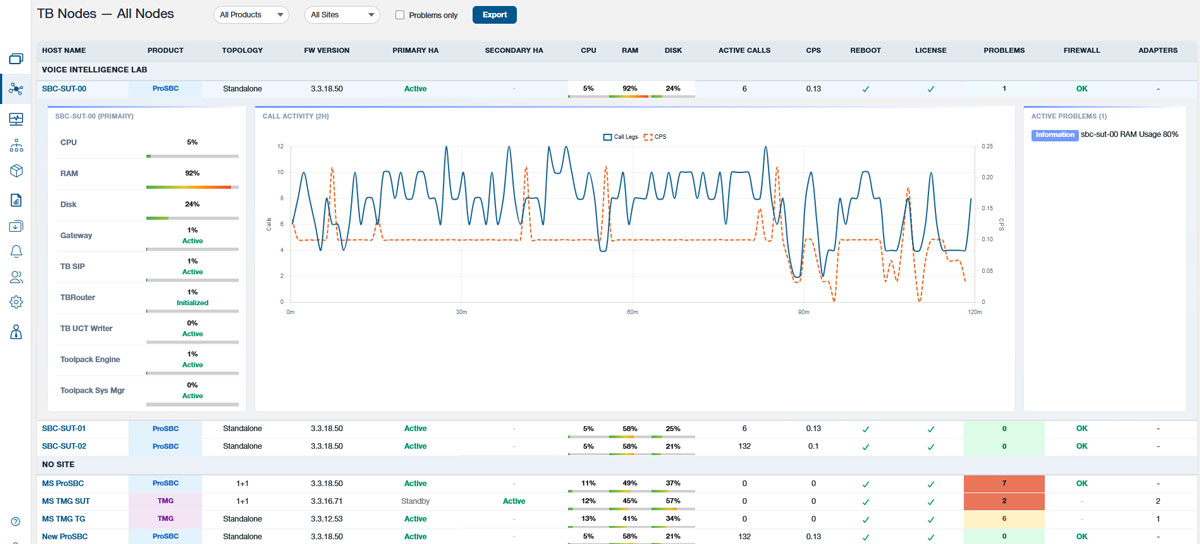
Every node in the fleet with firmware, HA state, and live CPU, RAM, and disk at a glance.
Every Node on One Screen
The all-nodes view shows every ProSBC and Tmedia device in your network with its product type, topology, firmware version, primary and secondary HA state, and live CPU, RAM, and disk usage. A per-node breakdown and live call-activity chart sit alongside it, so you see the shape of the fleet without clicking into anything.
A problem is visible before it becomes an outage, and a standby that is not ready is visible before the primary fails.
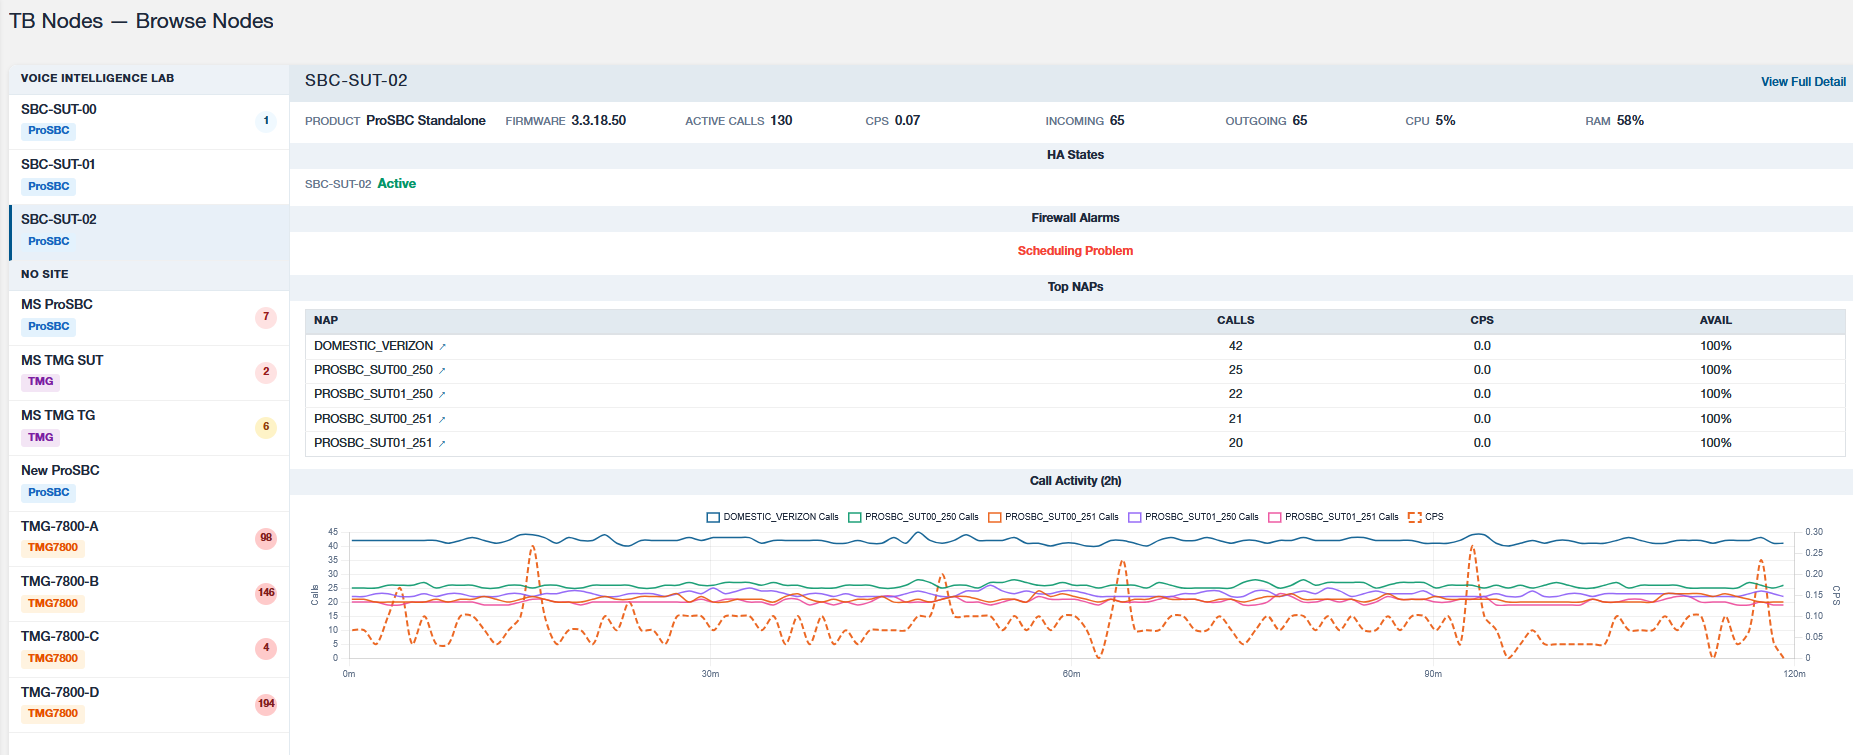
Per-node health across the fleet, aggregate call trends measured against history, and one reach to every node.
Health, Trends, and Reach in One Platform
Nodes brings together three layers that are usually spread across separate tools:
Host health — CPU, RAM, memory, and disk on every node, with HA state and firmware, so a problem is visible before it becomes an outage.
Call trends — aggregate call volume, answer rates, and failure rates plotted against historical baselines and earlier weeks.
Fleet reach — direct polling for local nodes, outbound connection or monitoring proxy for firewalled sites, one consistent view everywhere.
The result is one consistent view regardless of where each device lives, including nodes behind a customer firewall or in a distant region.
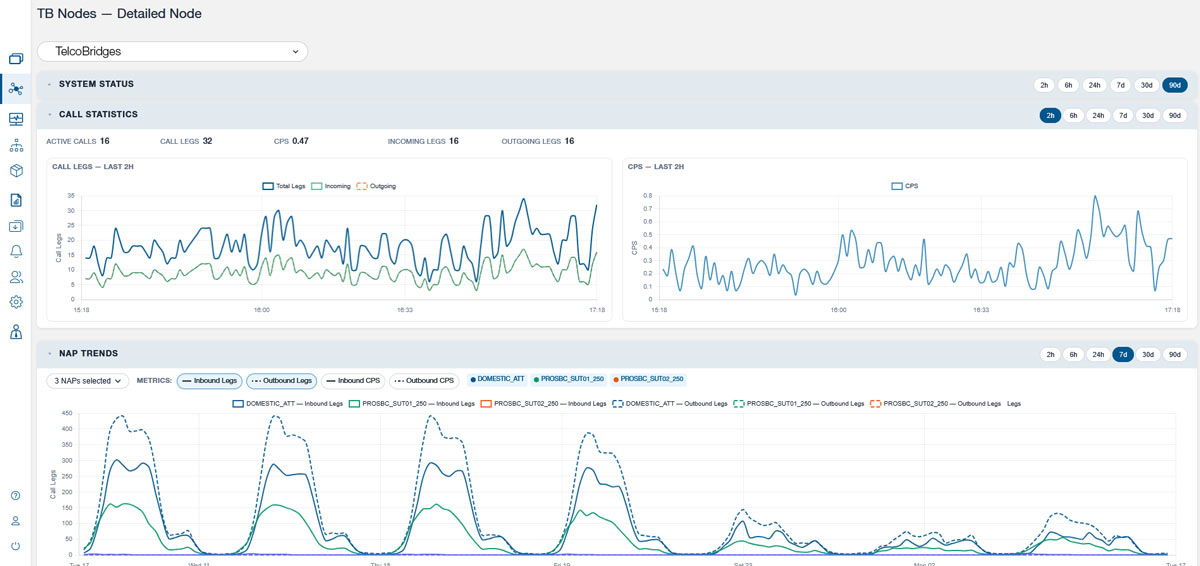
Call legs and CPS plotted as a weekly overlay, with the current days laid over the same days in earlier weeks.
Identify Anomalies in Real Time
You know 500 calls a minute is normal for a peak afternoon, but it should not happen at 3 AM. Nodes automatically measures live traffic against historical baselines so your team is not left guessing if a spike is real.
By comparing current volume to the same hour and day in prior weeks, you see problems forming well before an outage occurs.
Spot Traffic Shifts with Custom Historical Overlays
Overlay today’s aggregate traffic onto a trailing two-week average to catch sudden pattern shifts instantly. Need to analyze seasonal surges? Benchmark current performance against any specific historical period you choose.
Built for operational clarity: Overlaying a trailing average or matching specific historical periods lets teams instantly separate predictable traffic spikes from real network anomalies.
Manage the Fleet, Wherever It Lives
Nodes combines live telemetry with direct device management so your team can act on issues without switching tools. Because monitoring and control live together, fixing a problem takes seconds instead of a multi-app scavenger hunt.
Built for distributed fleets: a node behind a firewall can reach outbound to the platform on its own, so remote sites stay visible with nothing extra to maintain, and a local collector is available for the cases where outbound is not permitted.
What Nodes Monitors
Nodes watches far more than a handful of vital signs. The item count starts in the hundreds per node and climbs past a thousand on a busy device, because much of what is tracked is measured per NAP, per interface, and per line.
 System and host health
 System and host health
CPU, RAM, file-system usage, OAM state, firmware version and pending upgrades, license expiry, reboot-required and scheduling conditions, and dump files, on every host in the node.
Per-NAP visibility
Availability, state, usage, congestion, and SIP registration, plus per-NAP call legs, incoming and outgoing counts, accepted and answered calls, six flavors of calls-per-second, incoming and outgoing MOS, local, remote, and system drops, and rolling last-hour maximums.
Global call activity
Active calls and call legs, license usage, total, accepted, and answered call counts, and the full set of calls-per-second measures across the whole system.
Network interfaces
Per-Ethernet-port up state with sent and received bytes and errors, and per-IP-interface availability, link status, and throughput in both directions.
Hardware and TDM telemetry
Adapter status and HA state, per-CPU load, and per-line statistics for E1/T1/J1, DS3, and OC3/STM-1 spans, including APS protection state on optical lines.
Signaling protocols
H.248/MEGACO gateway state and terminations, and SS7 over M2UA link and peer states, monitored on the gateways that carry them.
Firewall health
DDoS alarms, high-CPU and list-full conditions, threshold alarms, and reboot or scheduling problems per host.
Catch Issues Early with Smart Alerts
Nodes routes real-time threshold alerts straight to the tools your team already uses, including email, Slack, Microsoft Teams, Discord, Telegram, and mobile push notifications. Beyond static thresholds, built-in predictive analytics track historical patterns to surface performance degradation before it impacts call quality.
You also get the full operational backing of TelcoBridges Monitoring as a Service. All telemetry is protected with end-to-end encryption, dashboards scale automatically as your network expands, and the same global engineering team behind ProSBC and Tmedia is ready to assist with scaling, optimization, and complex troubleshooting.
What Nodes adds: Element-management controls. While Monitoring as a Service provides deep fleet-wide visibility, Nodes brings the ability to act on those metrics directly from the same screen, with every action fully auditable.
Spot the Trend in Nodes, Resolve the Call in Trace
Designed to work seamlessly together, Nodes surfaces fleet-wide anomalies while Trace handles deep-dive call inspection. When Nodes identifies a traffic spike or capacity strain on a specific connection, Trace picks up the investigation, giving you full access to individual call legs and message flows.
Frequently Asked Questions
Can I see an individual call in Nodes?
No, and that is by design. Nodes is the network-wide view: per-node health, capacity, and aggregate trends. To open a specific call and read its SIP messages, use Trace. A trend in Nodes points you at the window and connection; Trace takes you into the calls.
What counts as a node?
How does it reach nodes behind a firewall?
Usually the node reaches out. The ProSBC establishes an outbound connection back to the platform and delivers its stats over it, so no inbound firewall holes are opened and there is nothing extra to run on site. For the cases where an outbound connection is not permitted, a lightweight local collector at the site polls the nodes and forwards their status over a single outbound connection instead.
How is this different from MaaS and TB Analytics?
Nodes builds on the same monitoring heritage and brings fleet-wide health, capacity, aggregate trends, and device management into the Voice Intelligence platform, alongside Trace and the AI layer, rather than as a separate tool.
How do I give AI access to my Nodes data?
Through the TelcoBridges MCP server. The MCP server connects your AI tools directly to Voice Intelligence data, including Nodes metrics, so any MCP-compatible model can query node health, fleet trends, and alerts without manual exports or custom integrations.
Take Full Command of Your Network with Nodes
Ready to bring real-time telemetry, historical trends, and direct management to every ProSBC and Tmedia device you run? Get in touch with our team below to get started.
Simple to buy, fast to deploy: fixed monthly billing, priced on maximum concurrent calls, with no long-term commitment and deployment in 48 hours.
By submitting this form, your information will be processed in accordance with our Privacy Policy.
Want the full platform picture first? Start with the Voice Intelligence overview.