End-to-end correlation · Full signaling depth · Carrier-grade proof
Pinpoint any call issue in seconds
with Trace
Correlate every leg across your fleet, drill down into full SIP signaling, and resolve root causes without jumping between SBCs.
See the network view
From Isolated Device Logs
to Full End-to-End Call Visibility
Instead of logging into individual SBCs to reconstruct broken call flows by hand, Trace automatically correlates every leg into a single, unified timeline. Your engineers can open any call, view every hop, and jump directly into message-by-message SIP flows to pinpoint issues in seconds.
When you find the answer, generate a branded report in one click to hand clear proof straight to your customer or carrier.
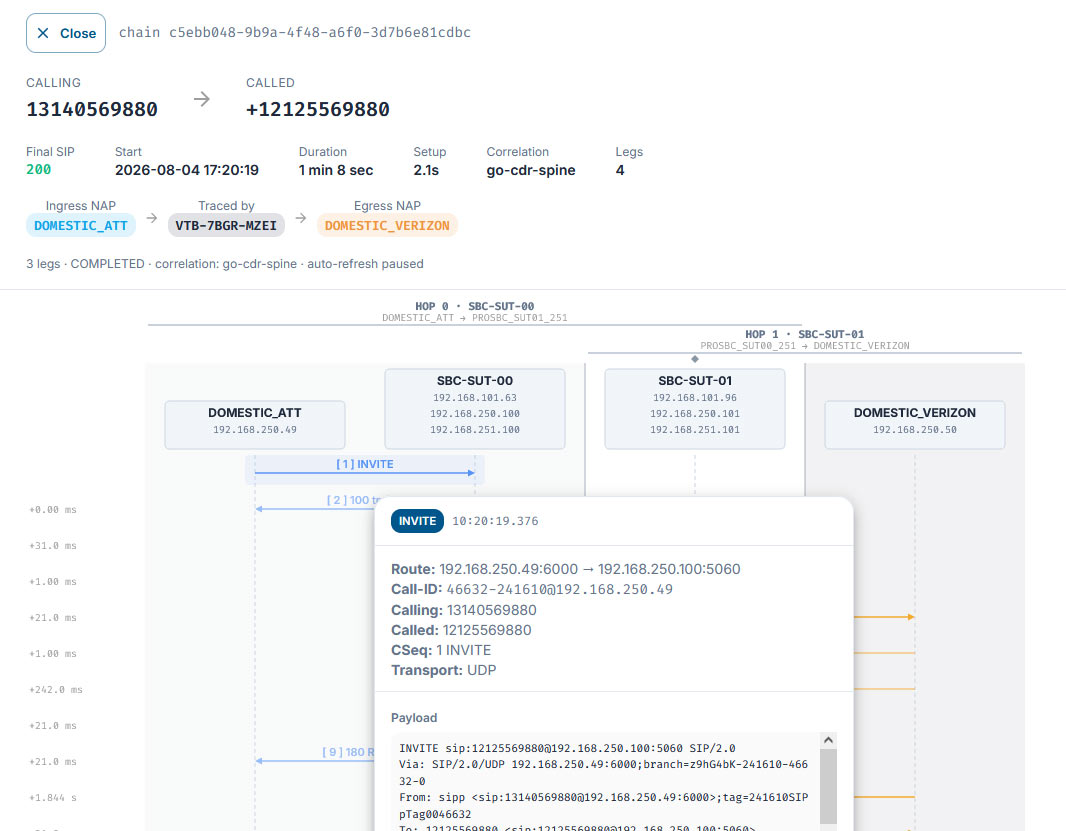
A real Trace call-flow ladder: every SIP message in the call, in order, across both legs, with the full message detail and payload one click away.
Read Every SIP Message on Every Call
Trace captures every SIP exchange as an ordered ladder, giving you full access to raw signaling across every leg. Drill straight into INVITE headers, provisional responses, offered and answered codecs, mid-call re-INVITEs, and precise release cause codes without relying on abstracted summaries.
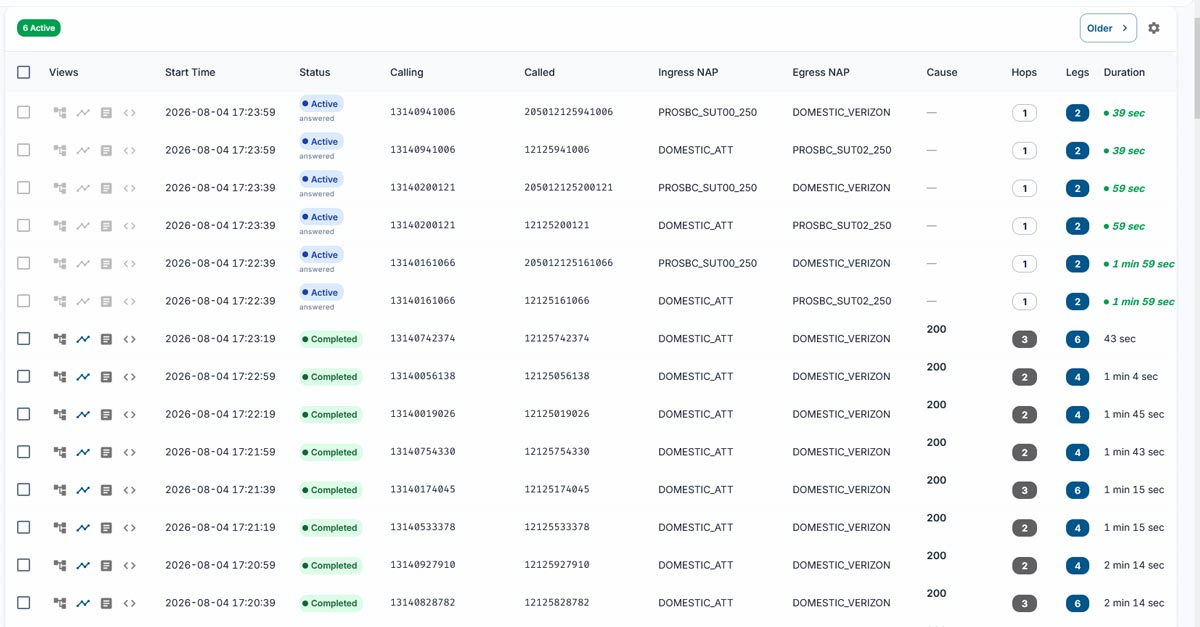
One call crosses three SBCs and out to the carrier as four separate legs, correlated into a single timeline. Any leg opens its own SIP ladder, timing, and release cause.
Gain Full Visibility Beyond the Carrier Edge
Trace delivers complete end-to-end visibility by correlating internal call legs across your fleet directly with carrier-side data. Your team gets the full call path in a single timeline, from your internal SBCs all the way through to partner carriers.
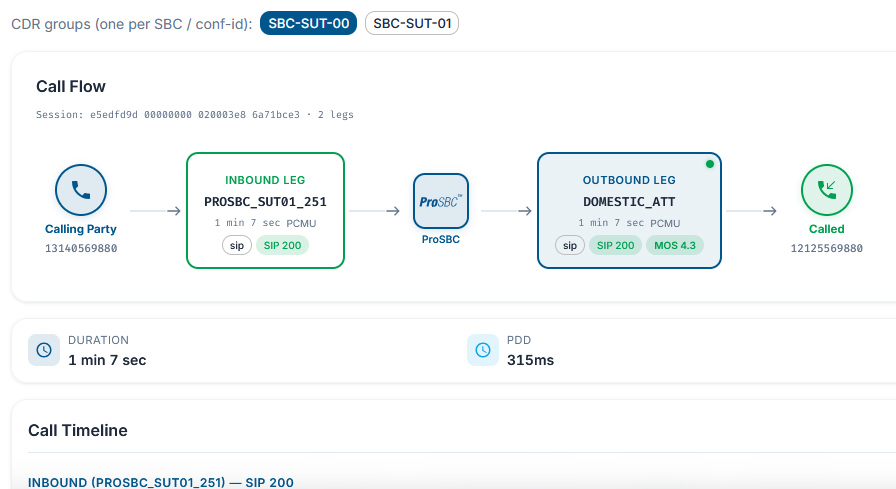
The CDR detail view: one call as a single readable flow from caller to called, with per-leg SIP result, MOS, codec, duration, and PDD.
Generate Branded Call Reports in One Click
Having full message visibility turns vague ticket descriptions into precise root causes. One beta user traced a problem to a telco partner that had begun prefixing an extra “1101” onto calls into a hosted number, making it four digits too long. No filtered CDR query would have surfaced it, because no one knew to look for it; the wrong length stuck out only because the full detail of the call was on screen.
Because the full detail is already captured, any call flow can be turned into a shareable report. Troubleshooting and proof become the same action.
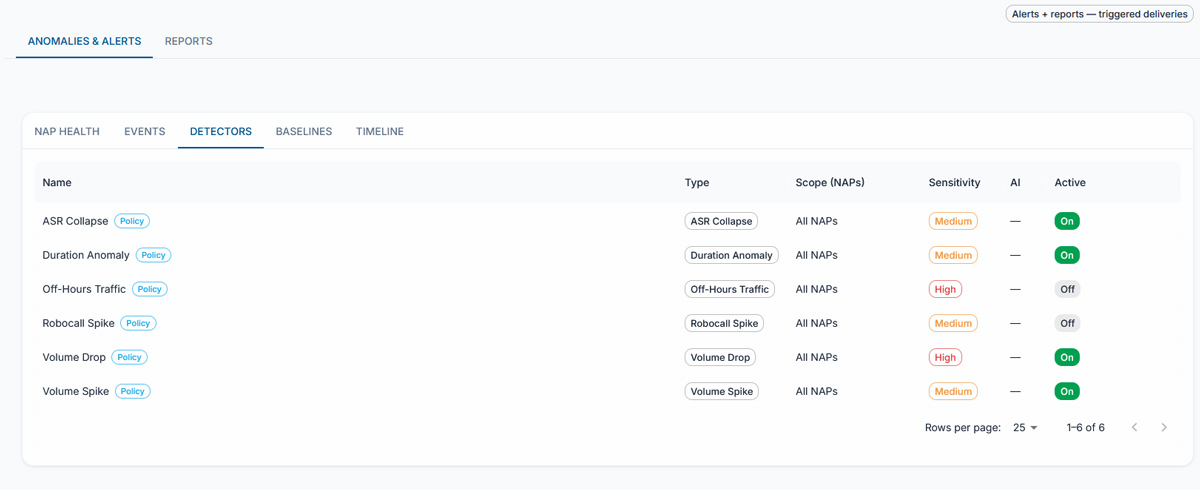
Detectors are created automatically across NAPs and nodes, watching for off-hours traffic, volume spikes, duration anomalies, ASR collapse, and robocall patterns.
Anomaly and Fraud Detection
Trace learns your network’s baseline traffic patterns to automatically flag anomalies as they form. When unusual traffic occurs, your team can drop straight from the alert into the individual call flows behind it.
Because toll fraud appears first as a traffic anomaly, watching these patterns in real time lets you catch and contain fraudulent calls early, long before the carrier invoice arrives.
Pair Trace with Nodes
for Complete Voice Network Visibility
While Nodes monitors fleet-wide metrics like CPU, RAM, and historical traffic patterns, Trace delivers message-level call diagnostics. Together, they streamline troubleshooting: Nodes points you to the exact time window and NAP experiencing an issue, and Trace lets you analyze the underlying calls down to the individual SIP message.
Frequently Asked Questions
How is Trace different from logging into the SBC and running a trace?
A device trace shows one device’s view of a call. Trace correlates every leg across the fleet into one timeline and lets you read the full SIP ladder for any of them, without logging into each device or grepping through trace files by hand.
How is Trace different from Nodes?
Trace is the deep, call-level pillar: open any call and read every SIP message. Nodes is the wide, network-level pillar: per-node CPU, RAM, and memory, aggregate call data, and trends against history. Trace goes into a single call; Nodes does not.
How far back can I look?
Retention is set to fit how you operate, so the right answer depends on your volumes and requirements. Tell our team what you need to keep and for how long and we will size it with you.
Can I share what I find with a customer?
Yes. A call flow or capture can be turned into a report and sent as evidence. Beta users have used exactly this to close out customer-reported issues with detail the customer found convincing.
Does Trace help with fraud detection?
Yes, at the call level. Because Trace has the full detail of every call and number, fraud signatures stand out: reshaped numbers, unusual destinations, or bursts of near-identical short calls. All fraud is an anomaly, so Nodes flags the suspicious pattern across the network and Trace is where you open the specific calls to confirm it and collect the evidence.
How do I give AI access to my Trace data?
Through the TelcoBridges MCP server. The MCP server connects your AI tools directly to Voice Intelligence data, including Trace call records and SIP captures, so any MCP-compatible model can search calls, inspect SIP ladders, and correlate legs without manual exports or custom integrations.
Trace Any Call on Your Own Network
Eliminate blind spots, protect your revenue, and equip your team to resolve voice issues in minutes instead of hours. Contact our team to see how Trace can bring full visibility to your ProSBC and Tmedia network.
Simple to buy, fast to deploy: fixed monthly billing, priced on maximum concurrent calls, with no long-term commitment and deployment in 48 hours.
By submitting this form, your information will be processed in accordance with our Privacy Policy.
Want the network-wide view too? See Voice Intelligence Nodes.