Mean Opinion Score (MOS): What It Is and How the SBC Maintains Voice Quality
Sooner or later, every voice operator has to answer one blunt question: how good is the audio, on a number? Mean Opinion Score is that number. When a customer says a call “sounded bad,” MOS is how you turn that into something you can measure, track, and argue about with a carrier.
In this article, we’ll walk you through what MOS stands for and what the scale means, where the score originally came from, the three different ways it gets measured today, what counts as a good score, and where a session border controller (SBC) fits into producing it. If you run voice infrastructure and field call-quality tickets, MOS is the common language that connects what a listener hears to what your network is doing.

What Does MOS Stand For, and What the Scale Means
MOS stands for Mean Opinion Score. It is the standard rating of perceived voice quality, expressed on a five-point scale defined by the ITU-T: 5 is excellent, 4 is good, 3 is fair, 2 is poor, and 1 is bad. A score is rarely a whole number in practice, so you will usually see values like 4.2 or 3.6.
The number most operators anchor on is 4.0. A MOS at or above 4.0 is considered toll quality, the standard of a clean traditional phone call, and it is the target for any business-grade voice service. Scores between 3.5 and 4.0 are acceptable but noticeably compressed or affected by the network. Below about 3.5, users start to complain, and below 3.0 a call is hard to hold.
The reason MOS is a perceptual score, rather than a pure engineering measurement, matters for everything that follows. It is meant to capture what a human actually hears, which is exactly why the score began its life as a listening test.
Where MOS Comes From: P.800 Subjective Testing
The original MOS is a subjective measurement, defined in ITU-T Recommendation P.800. A panel of listeners hears a set of audio samples under controlled conditions and rates each one from 1 to 5 using the Absolute Category Rating method. The published score is the arithmetic mean of those individual opinions, which is where the name comes from literally: the mean of the listeners’ opinion scores.
This method is the gold standard because it measures perception directly. No algorithm has to guess what a person would think, because real people did the rating. Its weakness is practicality. Assembling a listening panel is slow and expensive, and it can only score recorded samples after the fact. You cannot run a P.800 test on the live call a customer is complaining about right now. That gap is what pushed the industry toward measuring MOS by machine.
From Subjective to Objective: PESQ and POLQA
To approximate a listening panel without the people, the ITU-T standardized objective scoring algorithms. PESQ (Perceptual Evaluation of Speech Quality, ITU-T P.862) and its successor POLQA (Perceptual Objective Listening Quality Analysis, ITU-T P.863) both work by comparison: you feed the algorithm a clean reference sample and the degraded sample that came out the other end of the network, and it models how a human ear and brain would perceive the difference, producing a MOS-like score.
These are intrusive, full-reference methods. “Full-reference” means they need the original undegraded signal to compare against, and “intrusive” means they inject a known test signal into the path rather than listening to live traffic. That makes them excellent for lab testing, codec evaluation, and scheduled active probes, where you control both ends. It also means they are not the tool for passively scoring every live call as it happens, because real calls do not come with a reference copy attached.
Estimating MOS in Production: the E-Model and R-Factor
The method that does score live calls is the E-model, defined in ITU-T G.107. Instead of comparing audio samples, it computes quality from the network and codec parameters of the call itself. The E-model produces a transmission rating factor, the R-factor, on a scale of roughly 0 to 100, then maps that R value to an estimated MOS.
The R-factor is built from the impairments that degrade a call: the codec in use, packet loss, jitter (which becomes effective loss when packets arrive too late to play), and one-way delay. Each of these is a topic in its own right, and packet loss in particular is one of the largest single inputs to a falling score. If you want the diagnostic side of those impairments, the VoIP troubleshooting guide walks through how each one shows up on a call. For MOS, the point is that the E-model rolls all of them into one estimated number.
The advantage is decisive for operators: the E-model is passive and needs no reference signal, so it can produce a continuous quality estimate for every call in flight. That is why the MOS you see on a monitoring dashboard is almost always an E-model estimate, not a panel score.
Codec Ceilings: Why a Call Can Never Beat Its Codec
Every codec sets a maximum MOS that a call using it can ever reach. The compression and encoding the codec applies establishes a ceiling, and everything the network does from there can only subtract from it. A flawless network cannot push a call above its codec’s ceiling.
Commonly cited reference figures put narrowband G.711 in the low-to-mid 4s, narrowband G.729 around 4.0 (lower, because it compresses harder), and wideband codecs such as G.722 and Opus higher still, since they carry a broader audio range that listeners rate as clearer. The exact numbers vary by test, but the ranking is consistent and the lesson is practical: the codec you negotiate sets the ceiling, and managing the network protects the headroom underneath it. The G.711 vs G.729 comparison lays out the trade-offs that set those ceilings.
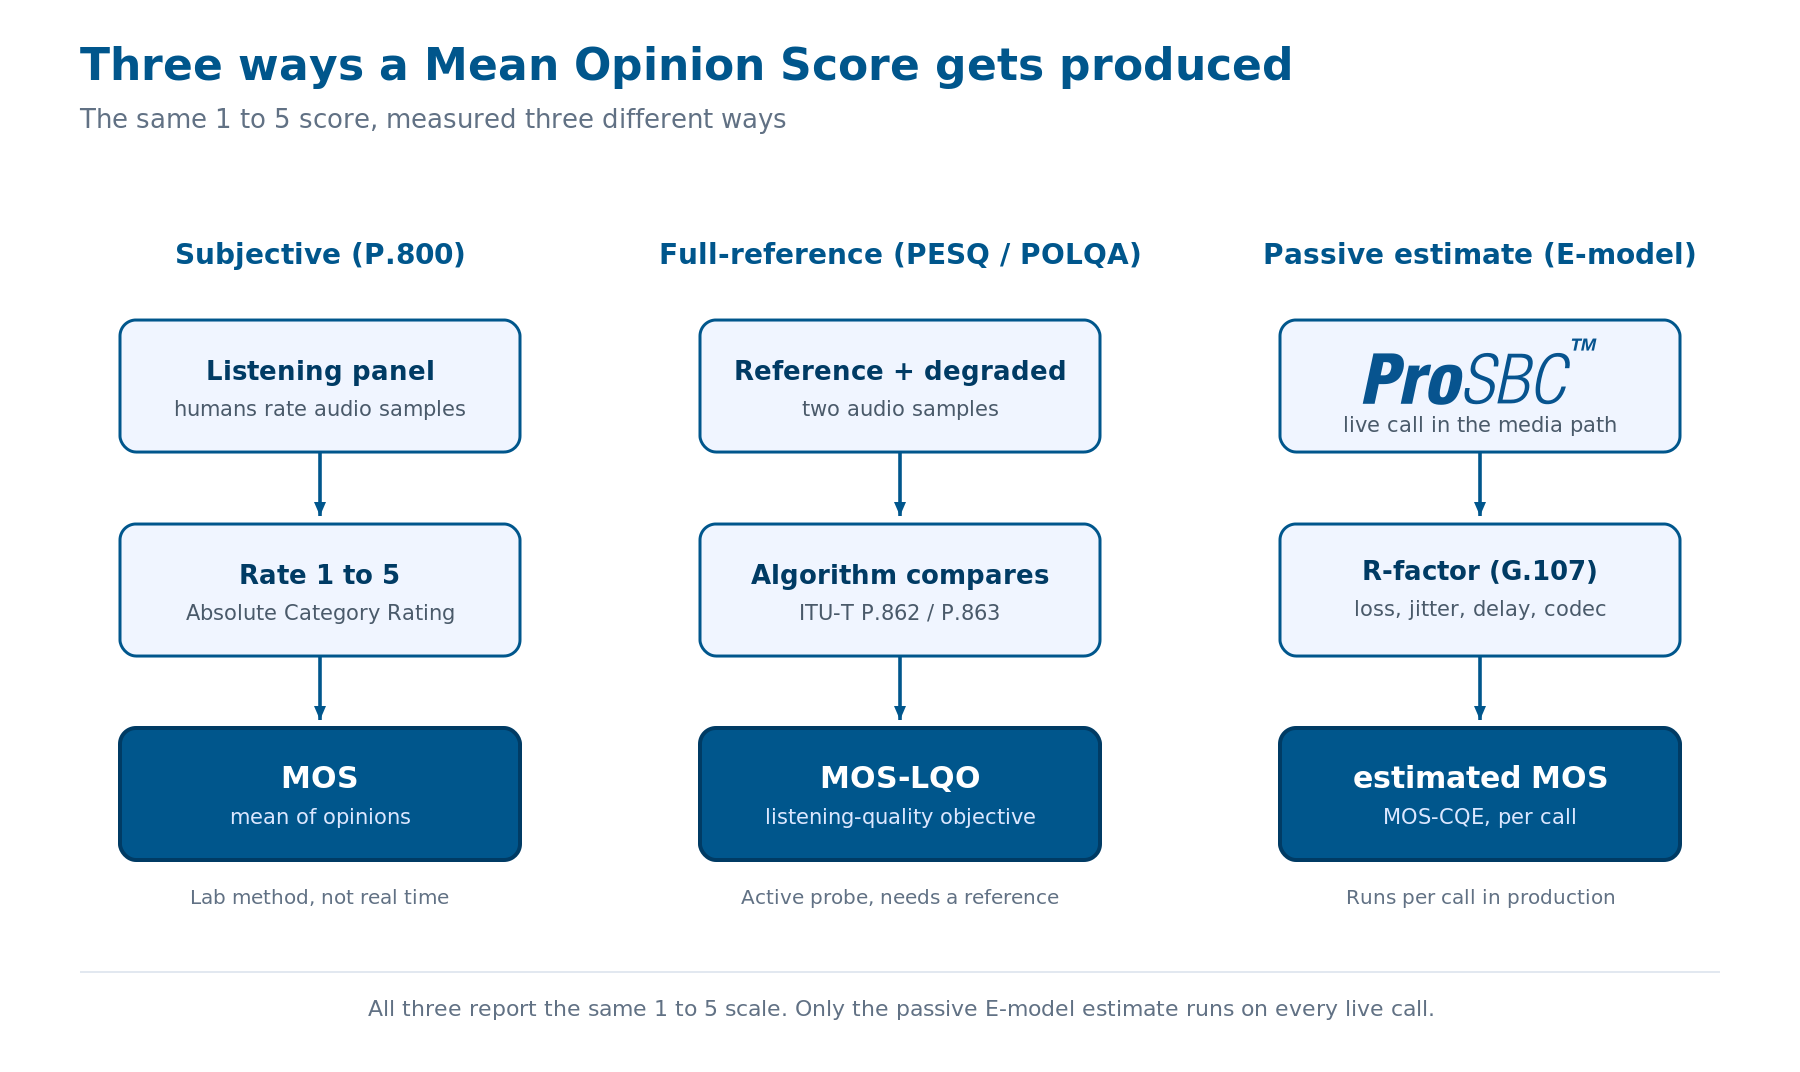
The same 1-to-5 score is produced three different ways. Only the passive E-model estimate is commonly used per call in production, where it is computed from live network and media statistics. Click to enlarge.
How an SBC Measures and Helps Maintain MOS
A session border controller earns its place here because, when media anchoring is enabled, it can observe media directly and collect per-call quality information. RTP carries the audio, and its companion protocol RTCP carries quality statistics back through the call. The extended report format, RTCP-XR defined in RFC 3611, adds a VoIP-metrics report block that can carry an estimated MOS along with loss and delay figures, so quality data travels with the call rather than being reconstructed afterward.
Because an SBC operates as a back-to-back user agent, fully terminating media on each side, it can observe per-call quality and hold per-codec baselines, and it can tell which leg of the call a problem sits on. Localizing a quality drop to a specific network segment is the heart of call-quality troubleshooting, and the broader practice of tracking MOS, jitter, latency, and packet loss together is covered in the VoIP monitoring best practices guide.
ProSBC exposes this directly. It produces per-call MOS scores alongside jitter and packet-loss figures, and makes them available through SNMP and CDR output, so the data flows into whatever monitoring platform you already run. For deep inspection, ProSBC also supports live packet capture and full SIP and RTP call trace, letting an engineer pull the actual packets behind a low score. TelcoBridges has more than twenty years of SIP and media deployment behind this capability, and ProSBC handles media at carrier scale.
One honest caveat: an SBC estimates and localizes quality, it does not manufacture it. It cannot create bandwidth that is not there or recover audio that a third-party network already dropped. What it gives you is an accurate, per-call MOS and the evidence to point at the segment responsible, which is most of what resolving a quality ticket actually requires.
Frequently Asked Questions
What does MOS stand for?
MOS stands for Mean Opinion Score, the standard 1-to-5 rating of perceived voice quality defined by the ITU-T, where 5 is excellent and 1 is bad.
What is a good MOS score for VoIP?
A MOS of 4.0 or above is considered toll quality and is the target for business-grade voice. Between 3.5 and 4.0 is acceptable but noticeably affected, and below about 3.5 users begin to complain.
Is MOS scored by a real person or an algorithm?
Both, depending on the method. The original P.800 score comes from a panel of human listeners. PESQ and POLQA are algorithms that approximate a panel by comparing a reference to a degraded sample, and the E-model estimates MOS from network parameters with no listening at all.
What is the difference between MOS, PESQ, and POLQA?
MOS is the score itself. PESQ (ITU-T P.862) and POLQA (ITU-T P.863) are two objective algorithms that produce a MOS-like value by comparing a known reference signal to the degraded output, with POLQA being the newer standard that also handles wideband audio.
Can an SBC improve MOS?
An SBC cannot raise the quality of audio a third-party network already degraded. It measures MOS per call, localizes a problem to a specific leg, and helps prevent self-inflicted degradation, which is how it protects the score you have rather than inventing a higher one.
Conclusion
MOS is a single number standing in for a human judgment, and its credibility comes entirely from the methodology behind it. A panel score under P.800, a full-reference algorithm score from PESQ or POLQA, and a passive E-model estimate are all called MOS, but they are produced in very different ways, and knowing which one you are looking at tells you how much to trust it and how to act on it. For live operations, the E-model estimate riding on RTCP is the number that matters, and getting it accurately, per call, is where the network edge does its work.
Maintain and Prove Voice Quality with ProSBC
When a call-quality complaint lands on your desk, a per-call MOS measured in the media path is what turns “it sounded bad” into a fact you can act on. ProSBC produces per-call MOS scores alongside jitter and packet-loss figures and exposes them over SNMP and CDR, so they flow into the monitoring platform you already run. As a full back-to-back user agent it observes media quality on each leg independently, and it supports live packet capture and full SIP and RTP call trace when you need to inspect the packets behind a score.
ProSBC scales to 60,000 sessions per server starting at as low as $1.40 per session per year, and you can prove all of it yourself in the free, permanent ProSBC Lab, a self-serve three-session license that takes about twenty minutes to set up. If you would rather have the dashboards watched for you, Monitoring as a Service builds on the same per-call data. For the wider picture, the session border controller guide covers everything an SBC does at the network edge.
Prefer to evaluate on your own first? Start your 30-day free trial.