SNMP for SBC and VoIP Monitoring: Ports, MIBs, and Operational Practice

How SNMP actually works on voice infrastructure: which ports carry what, how to read the SBC’s MIB, when to poll versus listen for traps, and how to wire it all into the monitoring platform you already run.
SNMP (Simple Network Management Protocol) is the common language network management platforms speak, and a session border controller sitting at the voice edge is one more device on the network that should be reporting into the same dashboards as your routers, switches, and servers. The protocol is general purpose, but the way you apply it to a voice platform has its own shape: the counters that matter are call and registration counters, the alarms that wake you up are HA failovers and SIP-layer attacks, and the security stakes are higher because the device lives at the network perimeter.
If you are an engineer responsible for keeping voice infrastructure healthy, this article walks you through SNMP from the operational angle: the ports it runs on and why, the difference between polling and traps, the three SNMP versions and which one belongs on an edge device, how to read what the SBC exposes through its MIB, and how to connect ProSBC into Zabbix, PRTG, SolarWinds, or any other platform that speaks SNMP. For the broader question of which voice metrics to track and how to set thresholds, the VoIP monitoring best practices guide covers the strategy side; this page stays on SNMP itself.

SNMP Ports: 161 and 162 Explained
SNMP uses two well-known UDP ports, and keeping them straight is the foundation for everything that follows. Port 161 is where the agent on the device listens for incoming queries from the management station. When your NMS wants to know the SBC’s current session count or system uptime, it sends a request to UDP 161 on the SBC and reads the reply. Port 162 runs in the opposite direction: it is where the management station listens for traps and informs that devices push to it. When the SBC needs to announce that a failover just happened, it sends that notification to UDP 162 on the manager.
SNMP normally uses UDP (ports 161 and 162), although TCP transport is defined for some implementations and specialized deployments. Monitoring traffic needs to stay lightweight and must not add load or latency to a device that is already busy passing calls, so SNMP accepts the small risk of a lost packet in exchange for minimal overhead. A dropped poll simply gets retried on the next interval, and the consequences of a missed trap are handled by using informs where guaranteed delivery matters.
The values 161 and 162 are the IANA-registered defaults, and almost every deployment leaves them as they are so that NMS auto-discovery works without special configuration. They are not immutable, though. On ProSBC the trap destination, including its port, is a configurable field, so you can point notifications at a manager listening somewhere other than the standard 162 if your environment requires it. The practical takeaway for firewall planning is that you open UDP 161 inbound to the SBC from your management network for polling, and UDP 162 inbound to your NMS from the SBC for traps. Because the SBC lives at the perimeter, those rules should scope the source to the management subnet rather than leaving the ports open to the world.
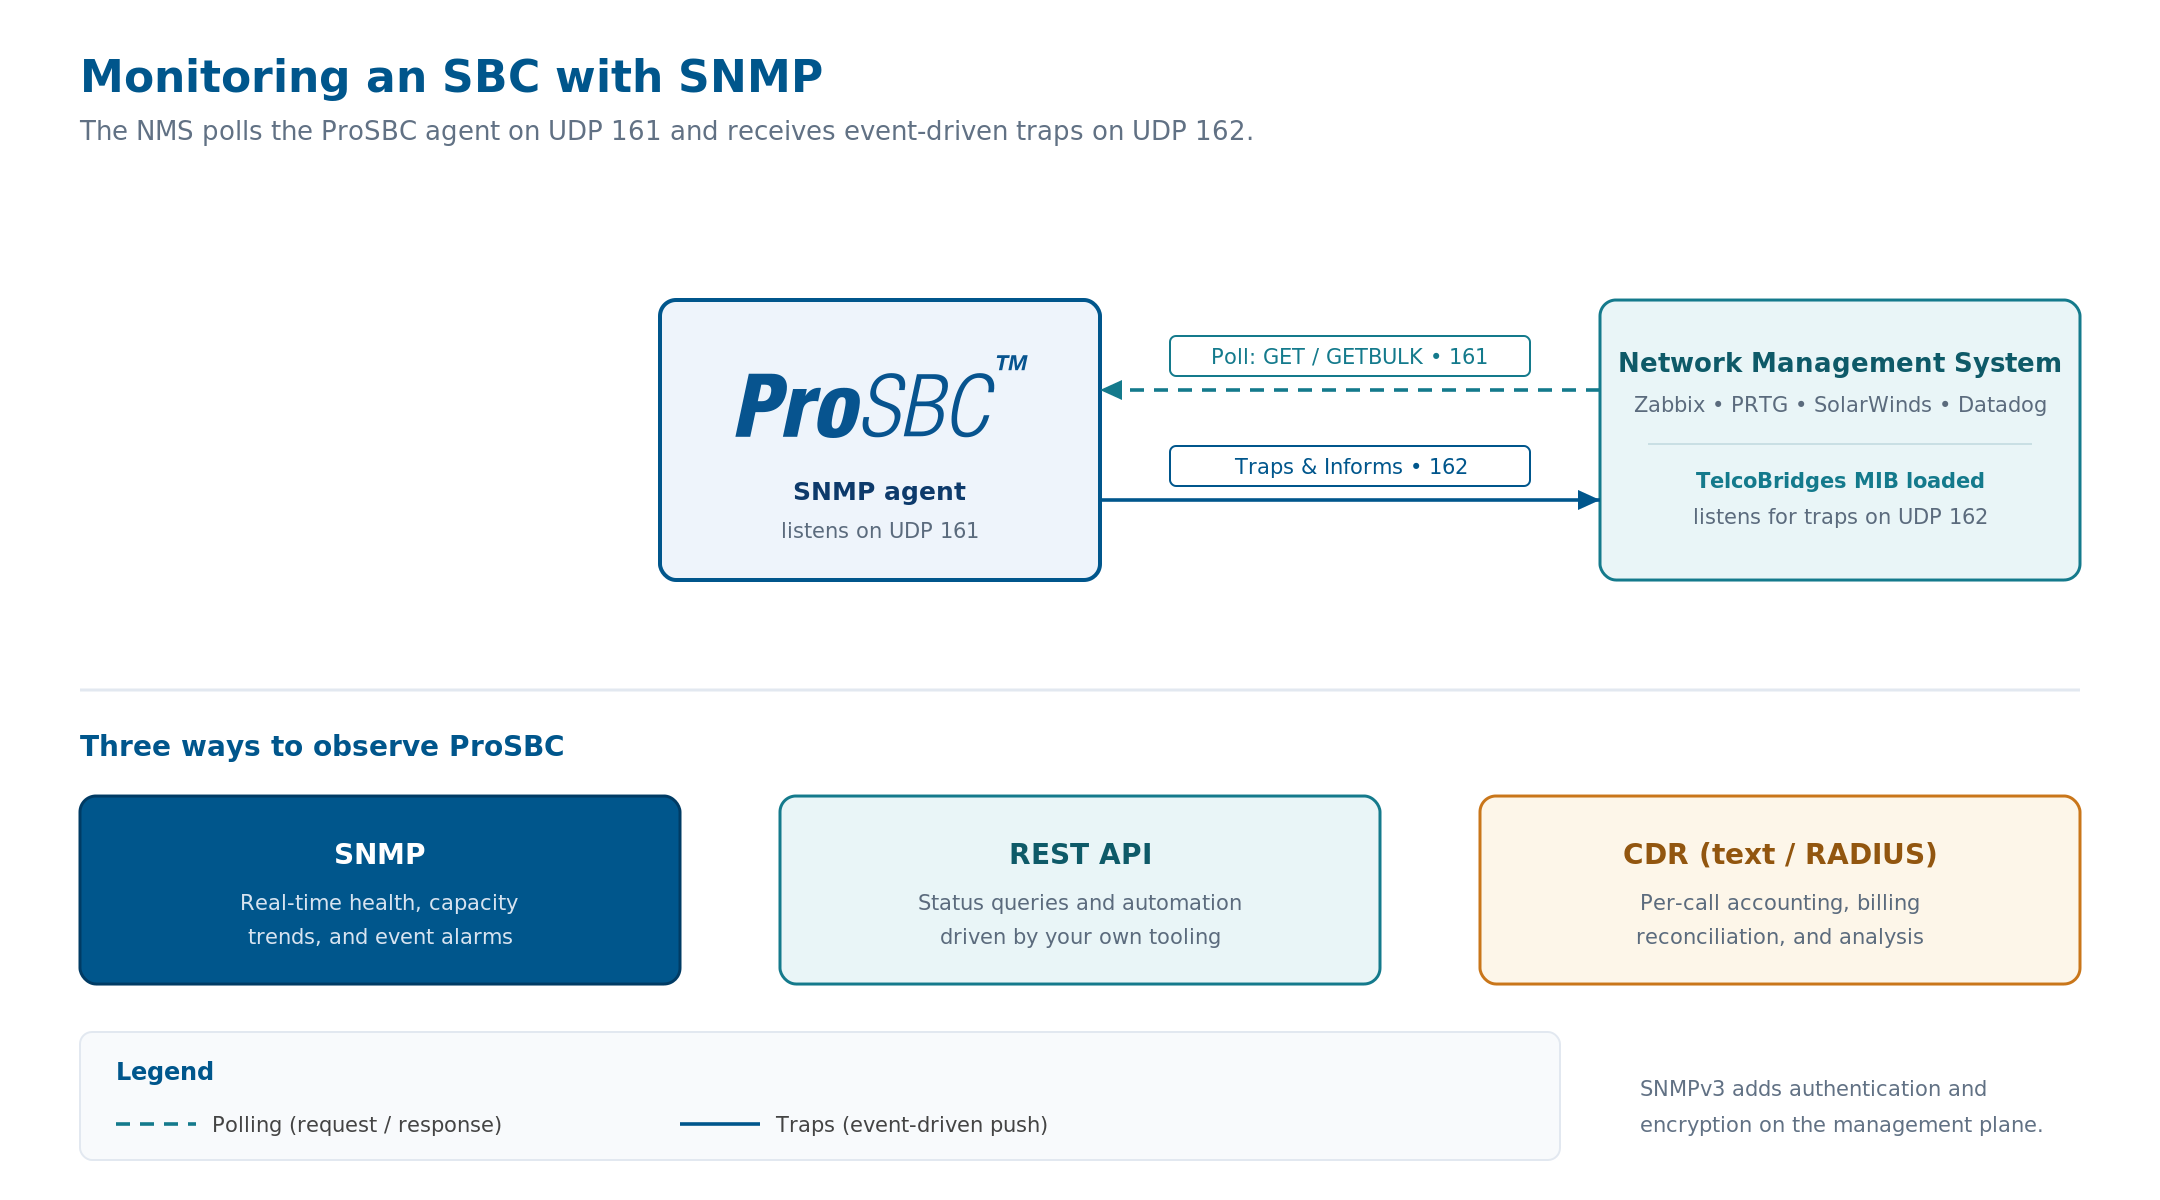
SNMP monitoring topology for an SBC: the NMS polls the ProSBC agent on UDP 161 and receives event-driven traps on UDP 162. The TelcoBridges MIB, loaded into the NMS, translates the agent’s OIDs into named metrics. REST API and CDR output run as separate channels for status queries and per-call accounting. Click to enlarge.
Polling Versus Traps: Two Directions of Monitoring
SNMP moves data in two directions, and a healthy monitoring setup uses both. Understanding when each one fits is what separates a noisy alerting system from one your team actually trusts.
Polling is the manager asking the agent for a value on a schedule, say every 60 seconds. It is how you build the graphs that show session count, CPU, memory, and registration totals trending over time. Polling gives you the continuous baseline that makes capacity planning possible and lets you spot a slow drift before it becomes an outage. Its limitation is resolution: anything that happens and resolves inside the polling interval can be missed entirely, and tightening the interval to catch fast events multiplies the query load across every device you watch.
Traps flip that model by having the agent push a notification the instant an event fires, so a failover or a threshold breach reaches your NMS in real time rather than waiting for the next poll. This is what you want for anything time-sensitive on a voice platform. The trade-off is that a standard trap is fire-and-forget over UDP, so if the packet is lost the event is simply gone. Informs solve that by requiring the manager to acknowledge receipt, which is worth the extra round trip for the alarms you cannot afford to miss.
In practice you poll for trends and you trap for incidents. Poll the SBC’s counters to feed dashboards and capacity reports, and configure traps for the events that demand an immediate human response. Relying on polling alone leaves a blind spot during the seconds between intervals, and relying on traps alone leaves you with no baseline to interpret them against.
SNMP Versions: v1, v2c, and v3
Three versions of SNMP are in active use, and the difference between them is mostly about security, which matters a great deal for a device exposed at the network edge.
SNMPv1 is no longer recommended for new deployments. It authenticates with a community string and offers no encryption, and its limited error handling and counter sizes make it a poor fit for modern carrier traffic volumes.
SNMPv2c remains widely deployed because it keeps the simple community-string model while adding 64-bit counters, the more efficient GETBULK operation, and the inform notification type. The catch is the same one v1 carries: the community string crosses the network in cleartext, so anyone who can capture a packet can read it and reuse it. That is acceptable inside a locked-down management VLAN, and it is genuinely risky anywhere a community string could be sniffed.
SNMPv3 is the version that belongs on a session border controller. It replaces the community string with the User-based Security Model, which provides per-user authentication (HMAC with SHA) and optional payload encryption (AES). Running v3 in its authPriv mode means both the credentials and the monitoring data itself are protected on the wire, which is exactly the posture you want for a device that sits at the perimeter and reports on live call traffic. ProSBC supports both models: you can create an SNMPv1 or SNMPv2c community where a hardened internal network makes that practical, or create an SNMPv3 user where authentication and encryption are required. The same edge-security thinking that governs SBC security as a whole applies to the management plane, and SNMPv3 is how you extend it there.
What the SBC Exposes: Reading the MIB
Every value an SNMP agent can report has an OID, a dotted-decimal address such as 1.3.6.1.2.1.1.3.0 for system uptime. OIDs are organized as a tree, with standard branches that every device shares (the MIB-2 system and interface groups, for instance) and a private enterprise branch under 1.3.6.1.4.1 where each vendor defines its own objects. A MIB is the file that translates those numbers into names, so your NMS can display “system uptime” instead of a string of digits.
To monitor an SBC properly you load two kinds of MIB into your NMS. The standard MIBs give you the universal device health objects: uptime, CPU, memory, network interface status and throughput, and similar system-level data that you would collect from any server. The vendor’s enterprise MIB gives you the objects specific to the platform. For ProSBC, the TelcoBridges MIB is what your NMS needs in order to name and graph the SBC-specific objects, and it is the first thing to obtain when you set up monitoring, since without it the enterprise OIDs come back as raw numbers your platform cannot label.
The objects worth watching on a voice platform fall into a few groups: system health (CPU, memory, disk, uptime), the high-availability state of the node, active session and call counts against your licensed capacity, and endpoint registration totals. These are the values that tell you whether the platform is healthy and how close it is running to its limits. The deeper call-quality metrics that VoIP teams care about, things like answer-seizure ratio, post-dial delay, and Mean Opinion Score, are part of a wider monitoring picture that combines SNMP with CDR analysis and media statistics. The VoIP monitoring best practices guide covers which of those metrics to prioritize and how to set thresholds against them.
Mapping SNMP Traps to Operational Incidents
A trap is only useful if it maps cleanly to an action. The goal when you design your alerting is for every trap that pages a human to correspond to something a human actually needs to do, because an SBC that floods the NMS with low-value notifications trains your team to ignore the channel that should matter most. The table below shows the kind of mapping that works well for a voice platform.
| SNMP signal | What it usually means | Operational response |
|---|---|---|
| HA failover trap | The standby node has taken over from the active node | Page on-call immediately; investigate the failed node before the pair is exposed to a second fault |
| Session count nearing licensed capacity | Traffic is approaching the ceiling of the deployment | Plan capacity now; a hard ceiling drops new calls rather than degrading gracefully |
| Registration count spike or collapse | A registration flood, or an upstream outage dropping endpoints | Correlate with security logs; a flood is a possible SIP attack, a collapse points upstream |
| Interface down or link state change | A physical or virtual network path has dropped | Check the path before media is affected; one-way audio often starts here |
| Resource threshold (CPU, memory, disk) | The host is under pressure and may degrade | Investigate the cause; sustained pressure precedes quality problems |
The principle behind the mapping is that traps drive incidents while polling drives trends. You configure the SBC to trap on the state changes that need a fast response, and you lean on polled history to understand what was happening in the minutes before the trap fired. When a failover trap arrives, the polled graphs of CPU, sessions, and interface throughput leading up to it are what turn a raw alarm into a diagnosis.
Wiring ProSBC SNMP Into Your Monitoring Platform
Because ProSBC exposes a standard SNMP agent, the integration follows the same pattern as any other device on your network. Any platform that speaks SNMP can poll it, including Zabbix, PRTG, SolarWinds, and LibreNMS, as well as Datadog through its SNMP integration. There is no proprietary connector to install on either side, which is the whole point of using a standard protocol.
The setup runs in four steps on the ProSBC side. First, enable the SNMP agent in the system settings of the web portal. Second, create the credential the manager will use, either an SNMPv1 or SNMPv2c community for a hardened internal network or, preferably, an SNMPv3 user with authentication and encryption. Third, create a trap destination pointing at your NMS so event notifications have somewhere to go. Fourth, load the TelcoBridges MIB into your NMS so the polled OIDs and incoming traps display as named, graphable metrics rather than raw numbers.
From there, the work is platform-specific in the usual ways. In Zabbix you import the MIB, add the SBC as an SNMP host, and build items and triggers against the OIDs you care about. In PRTG you add SNMP sensors per metric. In SolarWinds you bring the node under management and select the OIDs to graph. In Datadog you configure its SNMP integration with the device profile and credentials. In each case the SBC is doing the same thing: answering polls on 161 and pushing traps to 162. The differences live entirely in how each NMS models and visualizes what it collects.
SNMP is not the only way to observe ProSBC, and for some integrations it is not the best fit. The platform offers three monitoring channels, and the right choice depends on what you are trying to do. If you would rather not run the collection layer yourself, Monitoring as a Service is a managed option that provides dashboards, threshold-based alerting through email, Slack, Teams, or Discord, historical analysis, and expert support on top of the same underlying data.
SNMP, REST API, and CDRs: Choosing the Right Channel
SNMP is the right tool for real-time device health and threshold alarms, but it is one of three ways ProSBC exposes operational data, and a complete monitoring picture usually draws on more than one. Picking the wrong channel for a job tends to produce either gaps or unnecessary complexity.
| Channel | Best for | How it works |
|---|---|---|
| SNMP | Real-time health, capacity trends, event-driven alarms | NMS polls the agent on 161 and receives traps on 162 |
| REST API | Status queries and configuration from your own tooling | Your system issues HTTP GET requests for status and state |
| CDR output | Per-call accounting, billing reconciliation, call-quality analysis | The SBC writes call detail records in text or RADIUS format |
The pattern most operators settle on is to use SNMP for the always-on health and capacity view, the REST API for scripted status checks and automation that lives inside their own systems, and CDRs for everything that has to be reconstructed per call after the fact. A command-line option, the tbstatus script run over SSH, is also available for quick spot checks during troubleshooting. SNMP tells you the platform is healthy and how loaded it is; CDRs tell you what happened on a specific call when you need to investigate one. The two answer different questions, and using each for its strength is more reliable than stretching one to cover both.
High-availability state is a good example of where SNMP earns its place. A 1+1 deployment is only as good as your awareness of which node is active and whether a failover has occurred, and an SNMP trap on the failover event plus polled HA state gives you exactly that. The architectural side of running redundant nodes is covered in the high availability and failover guide.
Frequently Asked Questions
What port does SNMP use?
SNMP uses two UDP ports. The agent on the monitored device listens on UDP 161 for polling queries from the management station, and the management station listens on UDP 162 for traps and informs pushed by devices. Both are IANA defaults; the trap destination port is configurable on ProSBC if your environment needs a non-standard value.
Should I use SNMPv2c or SNMPv3 for an SBC?
Use SNMPv3 on a session border controller. SNMPv2c sends its community string in cleartext, which is acceptable only inside a tightly controlled management network. SNMPv3 adds per-user authentication and payload encryption through the User-based Security Model, which is the appropriate posture for a device exposed at the network edge. ProSBC supports both, so you can match the version to your network’s security model.
Can I monitor ProSBC with Zabbix, PRTG, or SolarWinds?
Yes. ProSBC exposes a standard SNMP agent, so any SNMP-capable platform can poll it, including Zabbix, PRTG, SolarWinds, LibreNMS, and Datadog through its SNMP integration. The setup is the same as for any device: enable the agent, configure a community or SNMPv3 user, point a trap destination at your NMS, and load the TelcoBridges MIB so the metrics display with names.
What is the difference between an SNMP trap and a poll?
A poll is the manager asking the agent for a value on a fixed schedule, which is how you build trend graphs and capacity history. A trap is the agent pushing a notification to the manager the instant an event occurs, which is how you catch incidents in real time. You poll for trends and trap for incidents; a complete setup uses both.
Where do I get the ProSBC MIB?
The TelcoBridges MIB defines the enterprise-specific objects ProSBC reports, and you load it into your NMS so polled OIDs and incoming traps appear as named metrics. It is available through TelcoBridges support and documentation, and obtaining it is the first step when you set up SNMP monitoring, since without it the enterprise OIDs come back as unlabeled numbers.
How is SNMP monitoring different from CDR or REST API monitoring?
SNMP is for real-time device health, capacity trends, and event-driven alarms. The REST API is for status queries and automation driven by your own tooling. CDRs are for per-call accounting, billing reconciliation, and after-the-fact call analysis. SNMP tells you the platform is healthy and how loaded it is; CDRs tell you what happened on an individual call. Most operators use all three for their respective strengths.
Monitor Your Voice Edge With ProSBC
SNMP is how a session border controller earns its place in the same operational picture as the rest of your network. ProSBC ships a standard SNMP agent with SNMPv1, SNMPv2c, and SNMPv3 support and configurable trap destinations, so it drops into Zabbix, PRTG, SolarWinds, or any SNMP-capable platform without a proprietary connector. Alongside SNMP, the REST API and CDR output round out a complete monitoring stack for real-time health, automation, and per-call accounting.
If you would rather have the monitoring layer run for you, Monitoring as a Service provides dashboards, threshold alerting, and expert support on top of the same data. And if you want full operational coverage of the platform itself, Managed Service includes 1+1 HA, 24/7 support, and ongoing monitoring on the infrastructure of your choice.
Prefer to evaluate on your own first? Start your 30-day free trial.